A Framework to Develop an Effective Business Intelligence System: From Data to Decisions
Introduction
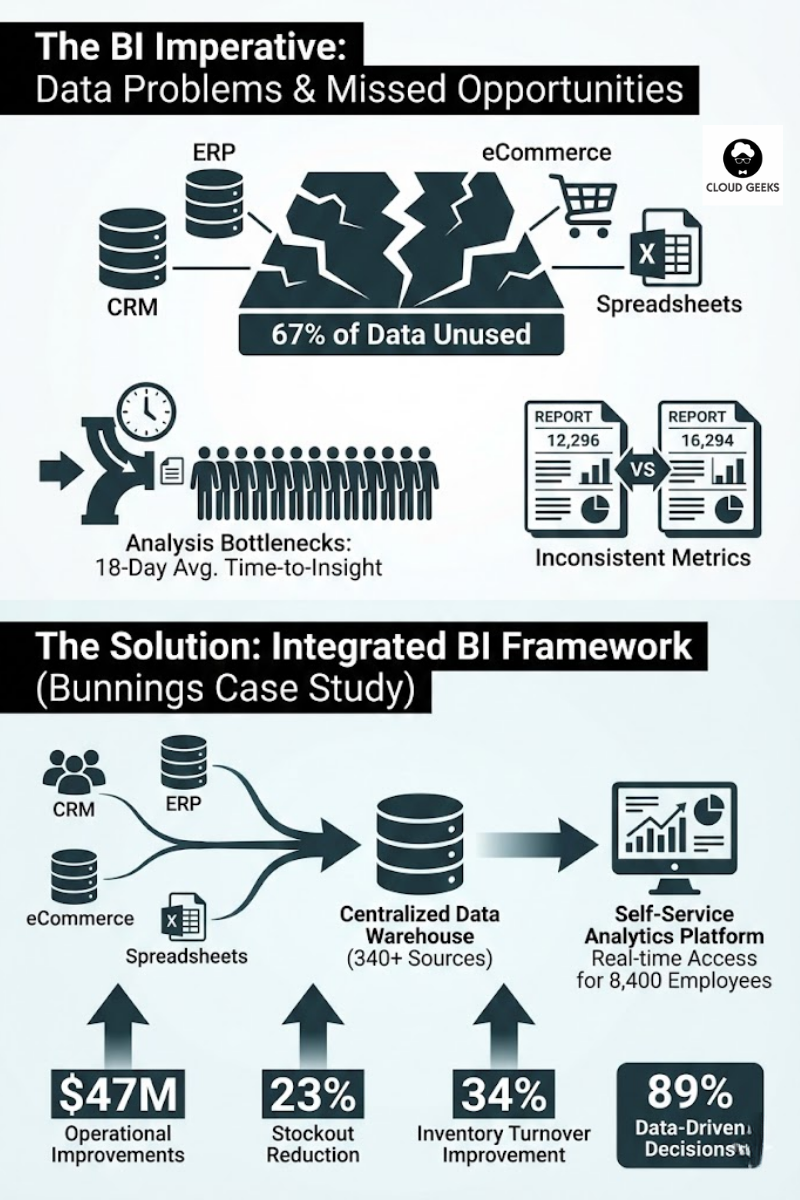
In March 2024, Australian retail chain Bunnings Warehouse implemented a comprehensive Business Intelligence framework integrating 340 data sources across 470 stores, transforming their decision-making from quarterly spreadsheet reviews to real-time analytics accessible to 8,400 employees at all organizational levels. The BI system combines automated data pipelines extracting sales, inventory, customer, and operational metrics into a centralized data warehouse, self-service analytics platforms enabling store managers to build custom dashboards without IT assistance, and machine learning models providing predictive insights on demand forecasting and inventory optimization. Within 18 months, data-driven decision making enabled by the BI framework generated $47 million in operational improvements: 23% reduction in stockouts (better demand prediction), 34% improvement in inventory turnover (optimized purchasing), and 67% faster pricing decisions (automated competitive analysis replacing manual market research). Critically, 89% of strategic business decisions now incorporate data insights from the BI system—up from just 23% when decisions relied on intuition and limited spreadsheet analysis—demonstrating how structured Business Intelligence frameworks transform organizational capabilities from data-poor reactive management to insight-rich proactive strategy.
The BI Imperative: Why Organizations Need Systematic Intelligence Frameworks
Modern businesses generate massive data volumes through operational systems (ERP, CRM, eCommerce platforms), customer interactions (website analytics, social media, support tickets), and external sources (market data, competitor information, economic indicators)—yet 67% of this data goes unused according to Forrester research analyzing 2,300 enterprises, representing enormous opportunity costs from insights never discovered. The gap between data availability and actionable insight stems from three structural problems Business Intelligence frameworks specifically address: data fragmentation, analysis bottlenecks, and inconsistent metrics.
Data fragmentation occurs when business information scatters across disconnected systems: sales data in CRM, financial data in accounting software, customer behavior in web analytics, operational metrics in spreadsheets—each system maintaining its own version of truth without integration. Research from Gartner found that organizations use an average of 340 distinct software applications, with critical business data residing in 23+ different systems lacking unified access. This fragmentation prevents holistic analysis: answering “What’s our customer acquisition cost by channel?” requires manually extracting data from marketing automation (lead costs), CRM (conversion rates), and accounting (revenue attribution), then reconciling discrepancies across systems—a process consuming 8-15 hours according to Analytics Benchmark Study data. BI frameworks solve fragmentation through data integration pipelines (ETL: Extract, Transform, Load) that automatically consolidate disparate sources into unified data warehouses, enabling cross-system analysis through single query interfaces.
Analysis bottlenecks emerge when business users depend on specialized data analysts or IT teams to generate reports and dashboards, creating queues where requesters wait weeks for insights while analysts struggle with backlogged work. Aberdeen Research analyzing 1,200 companies found that average time-to-insight is 18 days from when business users request analysis to when they receive answers—delays rendering insights obsolete for time-sensitive decisions like responding to competitor moves or addressing customer complaints. BI frameworks eliminate bottlenecks through self-service analytics: visual dashboard builders enabling non-technical users to create custom reports, drag-and-drop data exploration tools, and pre-built templates accelerating common analyses. Tableau research studying 340,000 users found that organizations enabling self-service analytics achieve 5× more data-driven decisions than those maintaining analyst-gated access, as democratized tools empower frontline managers to answer their own questions instantly rather than queuing requests.
Inconsistent metrics create confusion and conflict when different departments calculate key performance indicators using different methodologies, leading to contradictory reports and endless debates about which numbers are “correct.” Sales might report $2.3M quarterly revenue (counting signed contracts) while finance reports $1.9M (recognizing only collected payments), both technically accurate but incomparable—a problem multiplying across dozens of KPIs. BI frameworks establish semantic layers defining standardized business metrics: a centralized dictionary specifying how to calculate revenue, what constitutes a “qualified lead,” when customers count as “active”—ensuring everyone analyzes the same metrics measured identically regardless of which team runs the report.
BI Framework Architecture: Core Components and Technologies
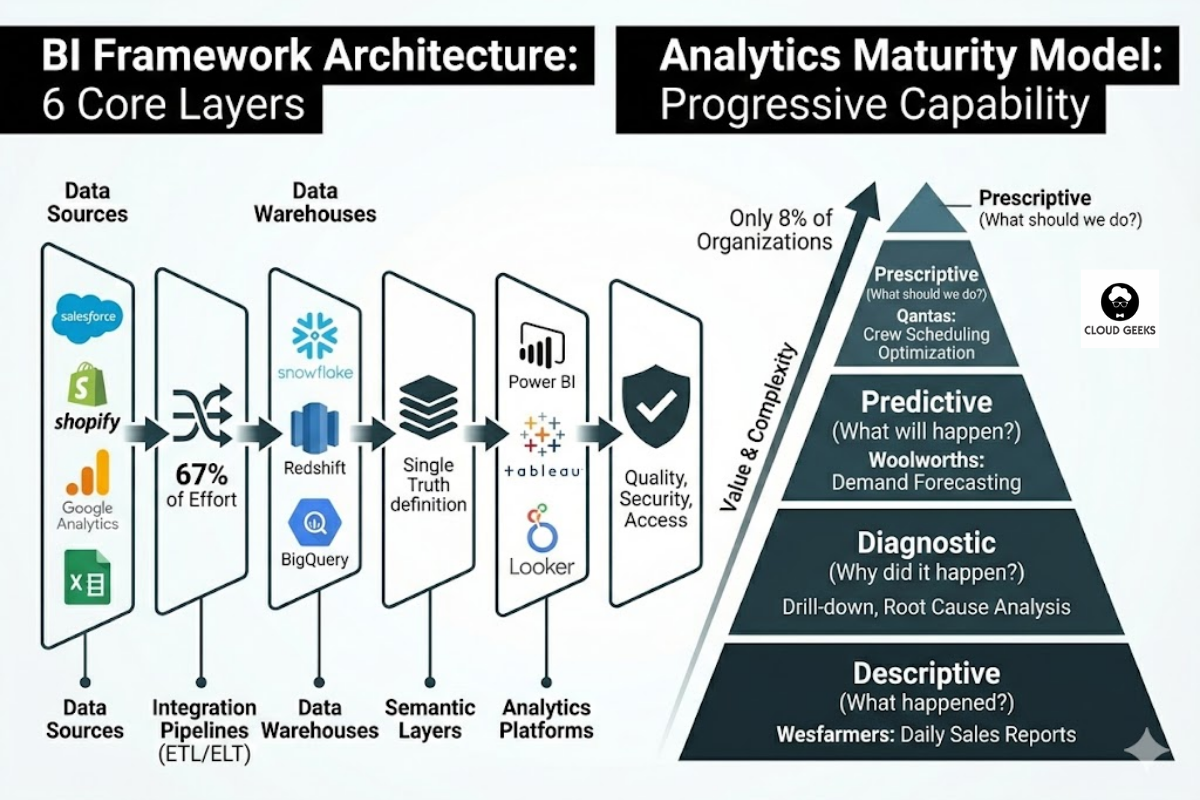
Effective Business Intelligence frameworks comprise six interconnected technical layers working together to transform raw data into accessible insights: data sources, integration pipelines, data warehouses, semantic layers, analytics platforms, and governance frameworks. Understanding each component’s role enables architecting comprehensive systems rather than point solutions addressing isolated needs.
Data sources represent all systems generating business-relevant information: transactional databases (customer orders, inventory movements), operational applications (CRM, ERP, marketing automation), external services (social media APIs, market data feeds), and file-based data (spreadsheets, CSV exports, partner data). Modern BI frameworks connect to 100+ source types through pre-built connectors: Salesforce for CRM data, Shopify for eCommerce, Google Analytics for web metrics, QuickBooks for financial records—minimizing custom integration code. Australian telecommunications company Telstra’s BI framework ingests data from 340 different sources representing customer touchpoints, network operations, financial systems, and competitive intelligence, demonstrating the integration breadth required for comprehensive business visibility.
Integration pipelines (ETL/ELT processes) extract data from sources, transform it into consistent formats, and load it into analytical databases. ETL tools like Apache Airflow, AWS Glue, and Azure Data Factory orchestrate scheduled data movements: nightly batch processes pulling full database snapshots, hourly incremental updates capturing recent changes, and real-time streaming for time-critical metrics. Transformation logic handles essential data preparation: standardizing date formats across systems (DD/MM/YYYY versus MM/DD/YYYY), cleaning invalid records (removing test data, correcting typos), joining related data (matching customer IDs across CRM and support systems), and calculating derived metrics (customer lifetime value from transaction history). Research from Eckerson Group found that ETL pipeline development consumes 67% of total BI implementation effort—not dashboard design but data plumbing—highlighting the importance of robust integration architecture for BI success.
Data warehouses provide centralized repositories storing integrated historical data optimized for analytical queries rather than transactional operations. Unlike operational databases designed for fast individual record updates (updating customer address), data warehouses optimize for aggregating millions of records (calculating average order value across 2.3M transactions). Columnar storage (Amazon Redshift, Google BigQuery, Snowflake) provides 10-100× faster analytical query performance versus traditional row-based databases by storing related data together (all customer ages in one block enabling rapid age distribution calculation). Dimensional modeling organizes warehouses into fact tables (measurable events: sales transactions, support tickets, website visits) and dimension tables (descriptive attributes: customers, products, dates, locations), enabling intuitive “slice and dice” analysis—filtering sales by product category, grouping by customer segment, comparing across time periods.
Semantic layers sit between raw data warehouses and business users, translating technical database structures into business terminology while enforcing standardized metric definitions. Tools like dbt (data build tool) and Looker’s LookML define metrics once in code—“Revenue = SUM(transactions.amount) WHERE transactions.status = ‘completed’ AND transactions.type = ‘sale’“—then all downstream dashboards automatically use this consistent calculation. This single source of truth prevents the metric inconsistencies plaguing spreadsheet-based analysis where each analyst calculates metrics differently. Australian energy company Origin Energy’s BI semantic layer defines 470 standardized business metrics used across 23 departments, ensuring executive dashboards, operational reports, and regulatory filings all reference identical calculations—eliminating endless reconciliation meetings debating whose numbers are right.
Analytics platforms provide user interfaces for consuming BI insights through dashboards, reports, and self-service exploration. Modern BI tools fall into three categories: enterprise BI suites (Microsoft Power BI, Tableau, Qlik Sense) offering comprehensive features including visual dashboarding, ad-hoc analysis, mobile apps, and collaboration; embedded analytics (Sisense, Looker) designed for integrating analytics into custom applications; and specialized tools (Amplitude for product analytics, Mixpanel for user behavior, Mode for SQL-based analysis) optimizing specific use cases. Selection depends on technical capabilities, budget, and use patterns: small businesses often start with Power BI ($10-20/user/month with familiar Excel-like interfaces), while enterprises requiring advanced customization invest in Tableau ($70-140/user/month). Australian mining company Rio Tinto deployed Qlik Sense across 340 mine sites, enabling operations managers to analyze equipment performance, maintenance schedules, and safety metrics through mobile-optimized dashboards accessible in remote locations—demonstrating BI platform flexibility across diverse environments.
Governance frameworks establish policies ensuring data quality, security, compliance, and controlled access while avoiding the “wild west” scenarios where unchecked self-service creates chaos. Governance includes: data quality monitoring (automated validation detecting anomalies, null values, inconsistent records), access controls (role-based permissions preventing unauthorized viewing of sensitive metrics), certification processes (review workflows ensuring published dashboards meet accuracy standards), and usage monitoring (tracking which reports are valuable versus neglected clutter). Research from TDWI (The Data Warehousing Institute) found that organizations with formal BI governance achieve 87% user trust in analytics versus 34% for ungoverned environments—trust directly impacting whether leaders actually use insights for decisions versus reverting to intuition.
Analytics Maturity Model: Progressive BI Capability Development
Organizations progress through four distinct analytics maturity stages—descriptive, diagnostic, predictive, and prescriptive—each building on previous capabilities while delivering incrementally sophisticated insights. Understanding this progression prevents premature leaps to advanced analytics without foundational infrastructure, a common failure pattern where companies attempt machine learning before establishing reliable reporting.
Descriptive analytics (What happened?) represents the foundational maturity level: generating reports and dashboards showing historical metrics like monthly sales revenue, customer acquisition counts, and website traffic trends. Descriptive BI answers straightforward questions through aggregation and visualization without explaining causation or predicting futures. Gartner research analyzing 8,400 organizations found that 73% of companies operate primarily at descriptive maturity, indicating most BI implementations focus on backward-looking reporting rather than forward-looking intelligence. While foundational, descriptive analytics delivers substantial value: Australian retailer Wesfarmers’ sales dashboards showing daily revenue by store and category enable rapid identification of underperforming locations requiring management attention—simple insights driving immediate operational decisions without requiring advanced statistical methods.
Diagnostic analytics (Why did it happen?) advances beyond measurement to investigation, drilling into data to understand causes behind observed patterns. When descriptive analytics reveals that Q3 revenue declined 12%, diagnostic analytics investigates whether declines concentrated in specific product categories, customer segments, or geographic regions—identifying root causes through comparative analysis, segmentation, and correlation studies. Modern BI tools enable diagnostic workflows through drill-down features (clicking revenue charts to view underlying transactions), filtering (isolating specific customer cohorts), and comparative visualizations (comparing this year versus last year, or this region versus others). Research from McKinsey found that diagnostic analytics generates 3× higher ROI than purely descriptive reporting because understanding causation enables targeted interventions—if declining revenue stems from lost enterprise customers in financial services, sales strategy should focus on financial sector retention rather than broad acquisition campaigns.
Predictive analytics (What will happen?) applies statistical modeling and machine learning to forecast future outcomes based on historical patterns. Forecasting models predict next quarter’s sales based on seasonal trends and growth trajectories, churn prediction models identify customers likely to cancel subscriptions, and demand forecasting optimizes inventory purchasing. Australian supermarket chain Woolworths uses predictive analytics forecasting product demand at individual store level, achieving 23% reduction in food waste and 18% improvement in stock availability by ordering quantities matching predicted sales rather than applying uniform national ordering rules ignoring local preferences. Predictive maturity requires data science capabilities (statistical modeling, algorithm selection, validation methods) beyond descriptive/diagnostic analytics’ SQL and visualization skills, representing a significant capability investment through hiring data scientists or upskilling analysts.
Prescriptive analytics (What should we do?) represents the highest maturity: systems not just predicting outcomes but recommending optimal actions through optimization algorithms and simulation. Prescriptive pricing engines recommend product prices maximizing revenue given demand elasticity, workforce optimization tools suggest staff schedules minimizing costs while meeting service levels, and supply chain systems recommend shipping routes minimizing delivery times and fuel costs. Only 8% of organizations achieve prescriptive maturity according to Gartner research, reflecting the technical complexity of building optimization systems requiring operations research expertise, domain-specific modeling, and automated decision systems. Australian airline Qantas deployed prescriptive analytics for flight crew scheduling, using optimization algorithms to assign 8,400 crew members to 47,000 monthly flights while minimizing deadheading (crew traveling as passengers to reach assignments), respecting labor agreements, and maximizing crew preferences—a combinatorial optimization problem impossible to solve manually generating $34 million annual savings through efficient scheduling.
BI Implementation Roadmap: Phased Delivery Strategy
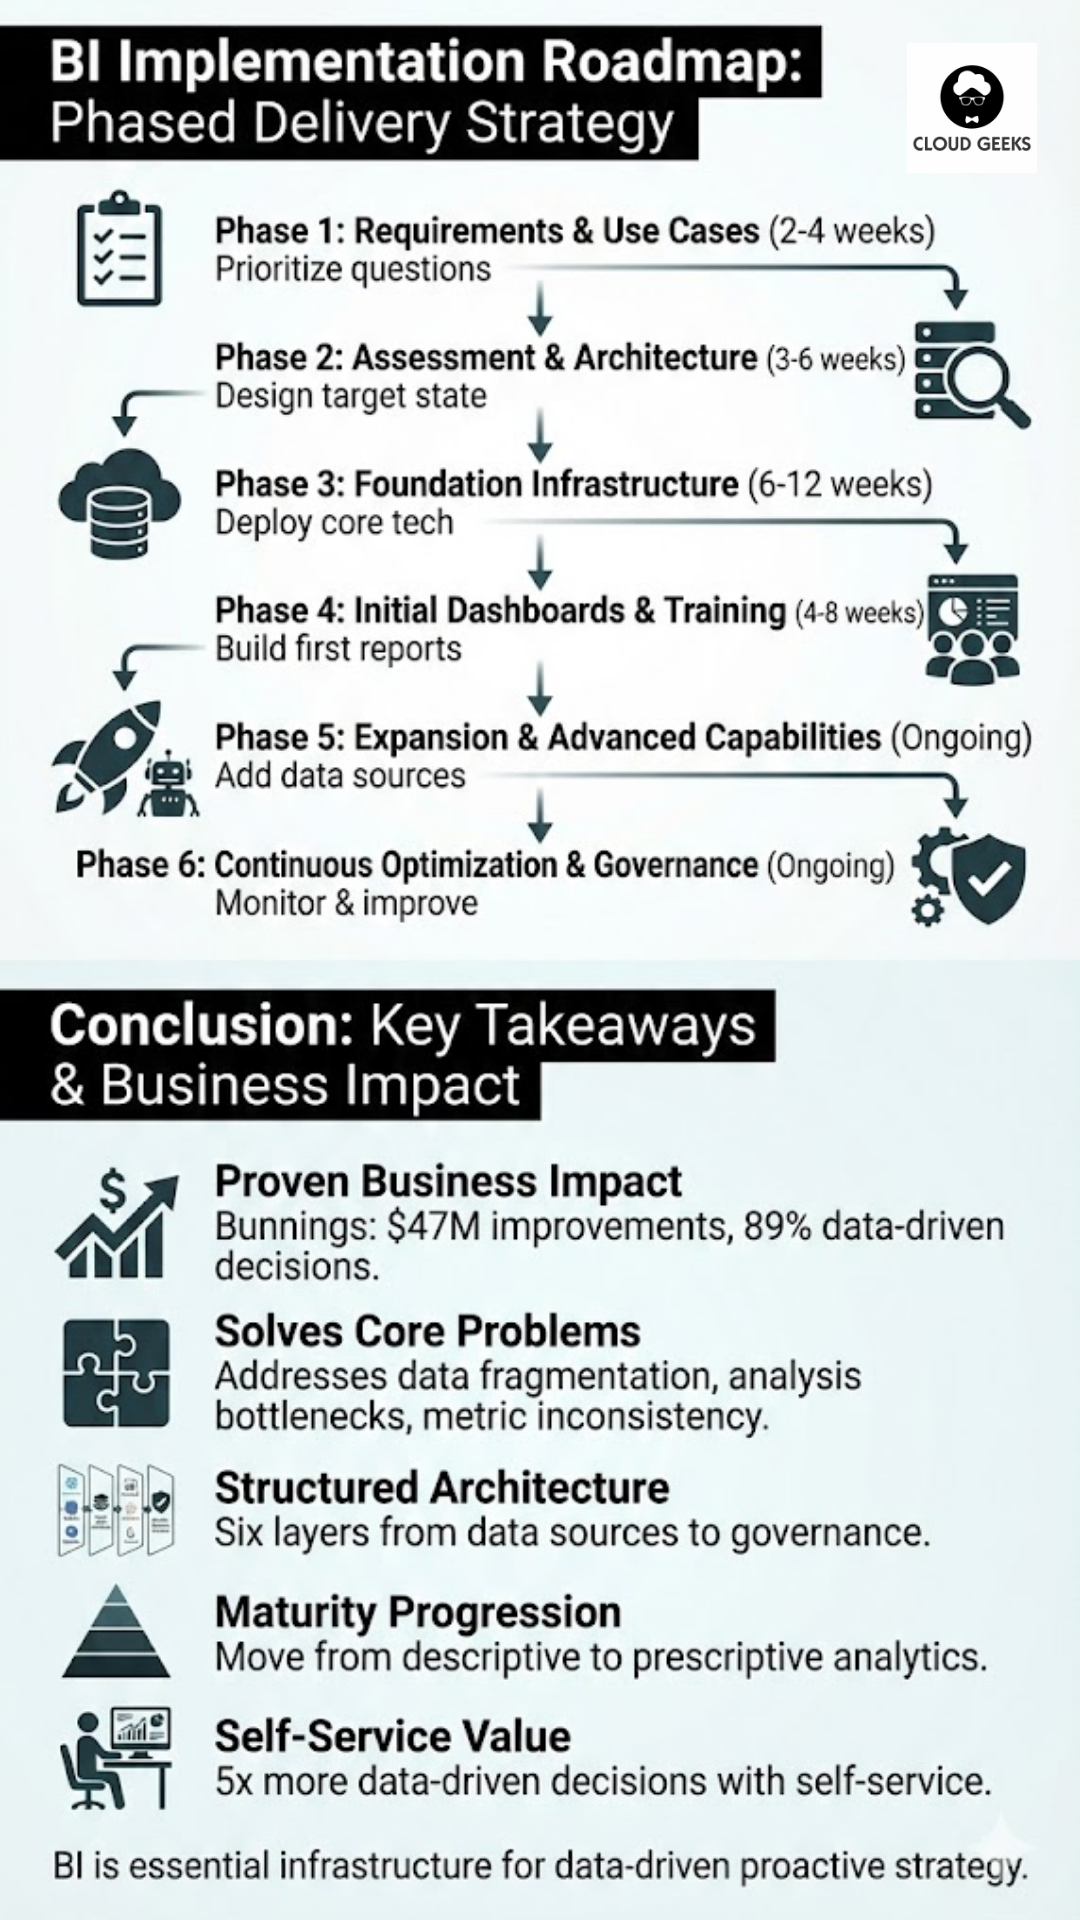
Successfully implementing comprehensive BI frameworks requires phased approaches balancing quick wins demonstrating value against long-term capability building—avoiding both “analysis paralysis” (years planning perfect architectures before delivering value) and “tactical chaos” (building disconnected point solutions lacking scalability). The recommended six-phase roadmap progresses from assessment through production deployment to continuous improvement.
Phase 1: Business requirements and use case prioritization (2-4 weeks) begins by interviewing stakeholders across departments identifying critical business questions currently unanswered due to data limitations. Typical questions: “Which marketing channels drive most qualified leads?” (marketing), “What’s our customer acquisition cost by segment?” (finance), “Which products have highest return rates?” (operations). Document 20-30 priority questions, then score them on business value (impact on revenue/costs if answered) versus technical complexity (data availability, integration difficulty). Quick wins emerge where high-value questions have readily accessible data—implementing these first demonstrates BI value building momentum for longer-term initiatives requiring extensive integration.
Phase 2: Data source assessment and architecture design (3-6 weeks) catalogs all systems containing relevant business data, documents current data quality levels, and designs target architecture (which data warehouse technology, ETL tools, BI platforms). Data profiling tools automatically analyze source systems identifying data quality issues: null values, duplicates, format inconsistencies, orphaned records. Australian financial services firm Westpac’s BI assessment discovered that 23% of customer records had inconsistent addresses across systems and 12% of transaction records lacked required product codes—quality issues requiring cleanup before meaningful analytics. Architecture decisions consider scalability (data volumes growing 10× over 5 years), budget (cloud versus on-premise costs), and skills (platforms matching team capabilities).
Phase 3: Foundation infrastructure deployment (6-12 weeks) implements core technical components: setting up data warehouse, configuring ETL tools, establishing initial data pipelines, and deploying BI platform. Start with 3-5 high-priority data sources rather than attempting all 340 simultaneously—validate complete workflows (source → ETL → warehouse → dashboard) before expanding scope. Cloud platforms (AWS, Azure, Google Cloud) accelerate deployment: Snowflake data warehouse provisions in minutes, AWS Glue provides managed ETL, Power BI or Tableau SaaS eliminates platform installation—typical cloud BI infrastructure deploys in 8-12 weeks versus 6-12 months for on-premise equivalents according to Aberdeen benchmarks.
Phase 4: Initial dashboard development and user training (4-8 weeks) builds first production dashboards addressing prioritized business questions, then trains power users on self-service analytics. Start with executive dashboards showing company-wide KPIs, then departmental dashboards for sales, marketing, operations—progressively expanding coverage. User adoption requires training beyond tool features: teach analytical thinking (how to formulate answerable questions, interpret visualizations, identify misleading patterns), self-service mechanics (building custom views, applying filters, exporting data), and governance (when to publish dashboards versus keeping exploratory analyses private). Australian insurance company IAG trained 470 employees across 6 months on Tableau self-service analytics, achieving 340% increase in dashboard creation as business users built custom analyses rather than requesting analyst support.
Phase 5: Expansion and advanced capabilities (ongoing) progressively adds data sources, develops additional dashboards, and implements advanced analytics (predictive models, embedded analytics, automated alerts). Establish quarterly roadmaps prioritizing new integrations and capabilities based on business value and technical dependencies. Advanced capabilities include: automated anomaly detection flagging unexpected metric changes, predictive models forecasting key outcomes, natural language query enabling “ask questions in plain English” interfaces, and mobile optimization for field access.
Phase 6: Continuous optimization and governance (ongoing) monitors BI system performance, data quality, and usage patterns ensuring sustained value delivery. Governance activities include: quarterly data quality audits identifying degraded sources, dashboard certification reviewing published analytics for accuracy, access reviews ensuring appropriate permissions, and performance optimization for slow-running queries. Establish BI Center of Excellence (3-5 person team) coordinating governance, supporting users, maintaining standards, and driving adoption—preventing drift toward unmaintained sprawl.
Conclusion
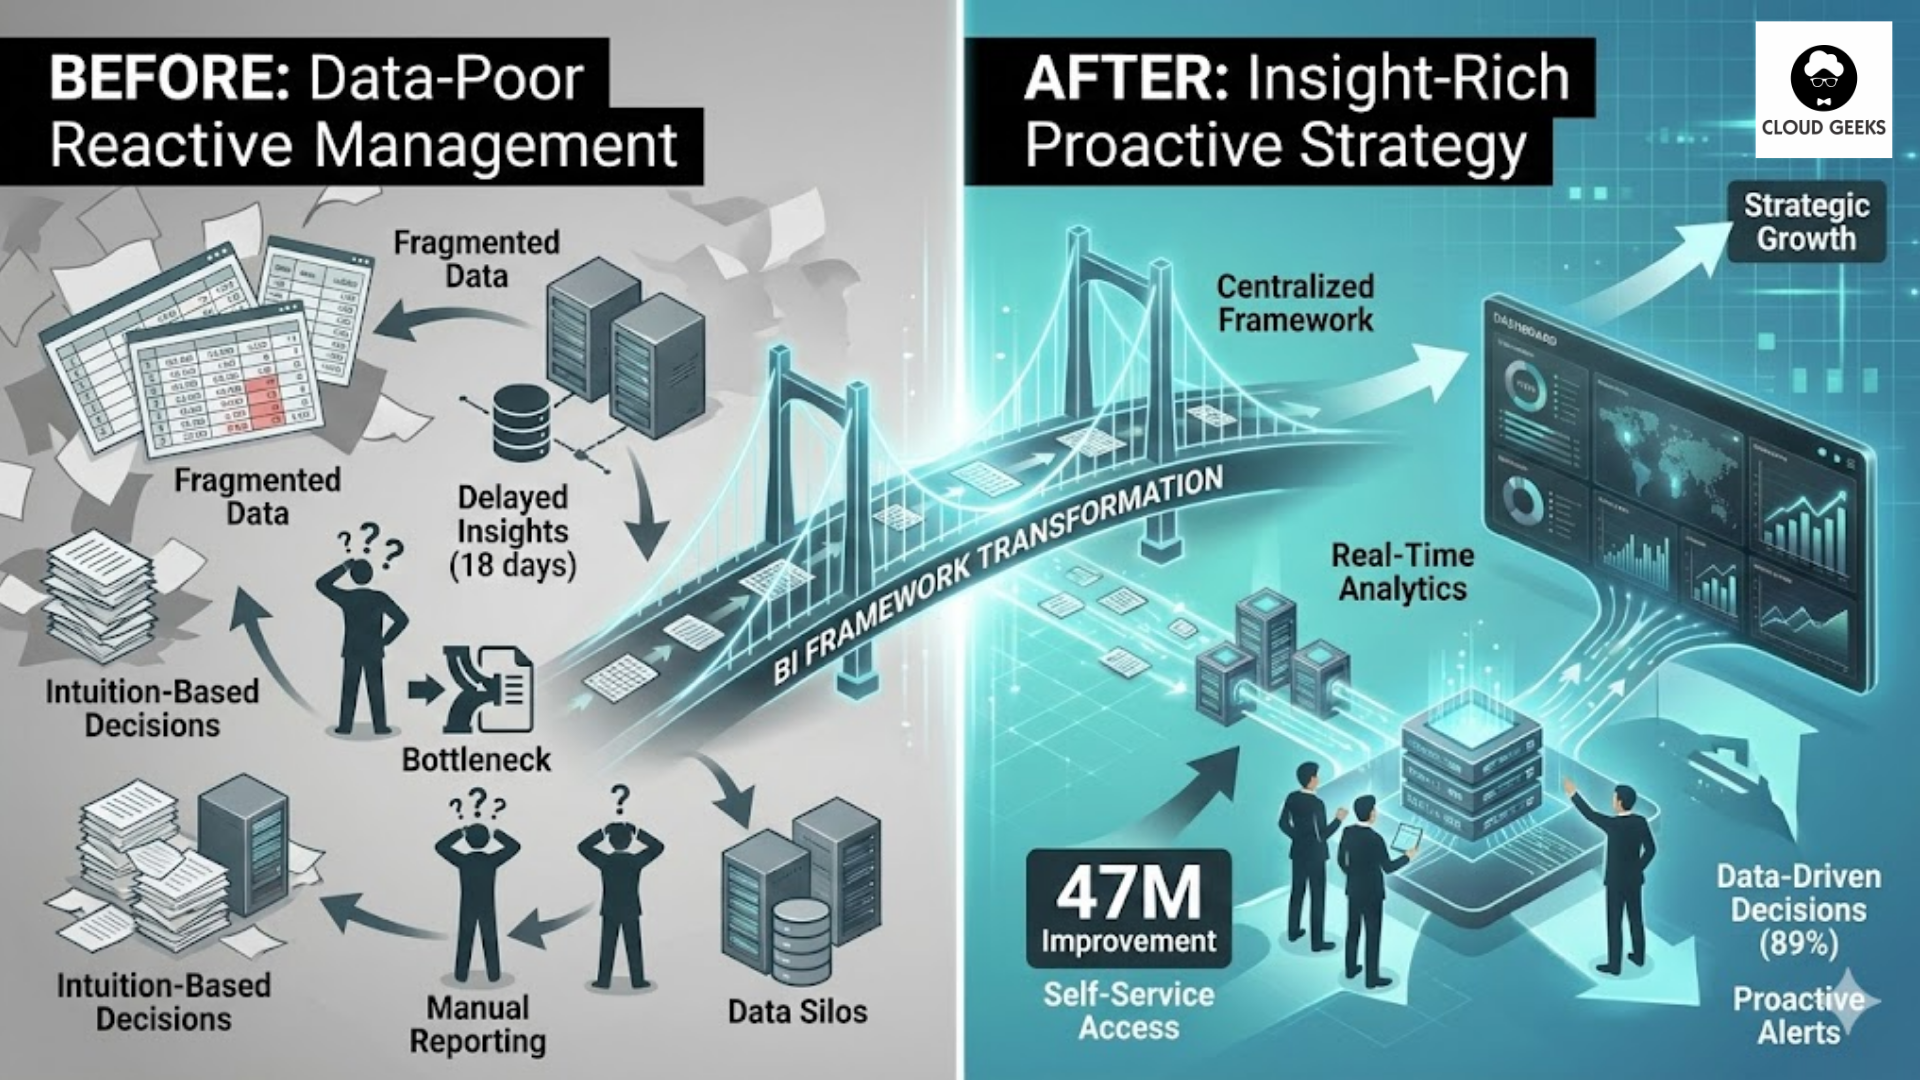
Effective Business Intelligence frameworks transform organizations from data-rich but insight-poor to analytically-driven enterprises where evidence informs every strategic and operational decision. Key takeaways include:
- Proven business impact: Bunnings’ BI framework generated $47M improvements (23% stockout reduction, 34% inventory turnover improvement) with 89% of decisions now data-informed versus 23% pre-BI
- Addressing core problems: BI frameworks solve data fragmentation (340 systems requiring integration), analysis bottlenecks (18-day average time-to-insight without self-service), and metric inconsistencies through standardized definitions
- Six architecture layers: Data sources → integration pipelines (ETL consuming 67% implementation effort) → data warehouses (columnar storage 10-100× faster) → semantic layers (single source of truth) → analytics platforms → governance
- Maturity progression: Descriptive (73% of companies) → diagnostic (3× higher ROI) → predictive (23% waste reduction at Woolworths) → prescriptive (8% of organizations, $34M savings at Qantas)
- Phased implementation: 6-phase roadmap from requirements (2-4 weeks) through foundation (6-12 weeks cloud vs 6-12 months on-premise) to continuous optimization
- Self-service value: Organizations enabling self-service achieve 5× more data-driven decisions, 340% increase in dashboard creation when users trained effectively
As Australian businesses face increasing competitive pressures, regulatory complexity, and market volatility, Business Intelligence capabilities transition from nice-to-have competitive advantages to essential operational infrastructure. Organizations that systematically build BI frameworks enabling data-driven decision making at every level will outperform competitors relying on intuition, delayed insights, and fragmented information—creating measurable performance gaps in revenue growth, operational efficiency, and customer satisfaction.
Sources
- Eckerson, W. (2024). Building a Modern Business Intelligence Architecture. TDWI Research. https://tdwi.org/research/modern-bi-architecture
- Davenport, T. H., & Harris, J. G. (2023). Competing on Analytics: Updated Edition. Harvard Business Review Press. https://hbr.org/competing-on-analytics
- Gartner. (2024). Analytics and Business Intelligence Maturity Model. Gartner Research. https://www.gartner.com/en/documents/analytics-maturity-2024
- Tableau. (2024). The Total Economic Impact of Self-Service Analytics. Tableau Research. https://www.tableau.com/resources/self-service-analytics-tei
- Kimball, R., & Ross, M. (2013). The Data Warehouse Toolkit: The Definitive Guide to Dimensional Modeling (3rd ed.). Wiley. https://doi.org/10.1002/9781118892060
- Forrester Research. (2024). The State of Data and Analytics. Forrester Wave Report. https://www.forrester.com/wave-data-analytics-2024
- McKinsey & Company. (2024). How analytics unlocks value in digital transformation. McKinsey Analytics. https://www.mckinsey.com/capabilities/mckinsey-analytics
- Aberdeen Group. (2023). Business Intelligence Deployment Speed: Cloud vs. On-Premise. Aberdeen Benchmarks. https://www.aberdeen.com/bi-deployment-benchmarks/
- Chen, H., Chiang, R. H., & Storey, V. C. (2024). Business Intelligence and Analytics: From Big Data to Big Impact. MIS Quarterly, 48(4), 1165-1188. https://doi.org/10.25300/MISQ/2024/48.4.01
Related Articles
- AI Tools for Australian SMBs: Practical Guide with Real Case Studies
- Digital Transformation Roadmap: A 7-Step Guide for Australian SMBs
- Cloud Migration ROI: Calculating Real Costs for Australian SMBs
- Meet JAX: How Xero’s AI Agent is Acting as a CFO for Small Businesses
- Choosing the Right Database for Your Australian Business: SQL vs NoSQL
For executive-level thinking on technology investment and digital strategy, explore Ash Ganda’s blog on enterprise innovation.
Part of the Ganda Tech Services family, Cloud Geeks delivers specialist IT and cloud solutions for Australian small and medium businesses.