Power BI for Australian Business Intelligence on a Budget
Power BI for Australian Business Intelligence on a Budget
Every Australian small business has data. Sales figures in your accounting system, customer information in your CRM, website analytics, and operational metrics scattered across spreadsheets. The challenge is turning that data into insights you can actually act on.
Power BI, Microsoft’s business intelligence platform, is accessible enough for small businesses to use without a data analyst on staff. And with the free tier or affordable Pro licensing, it does not require a significant investment to get started.
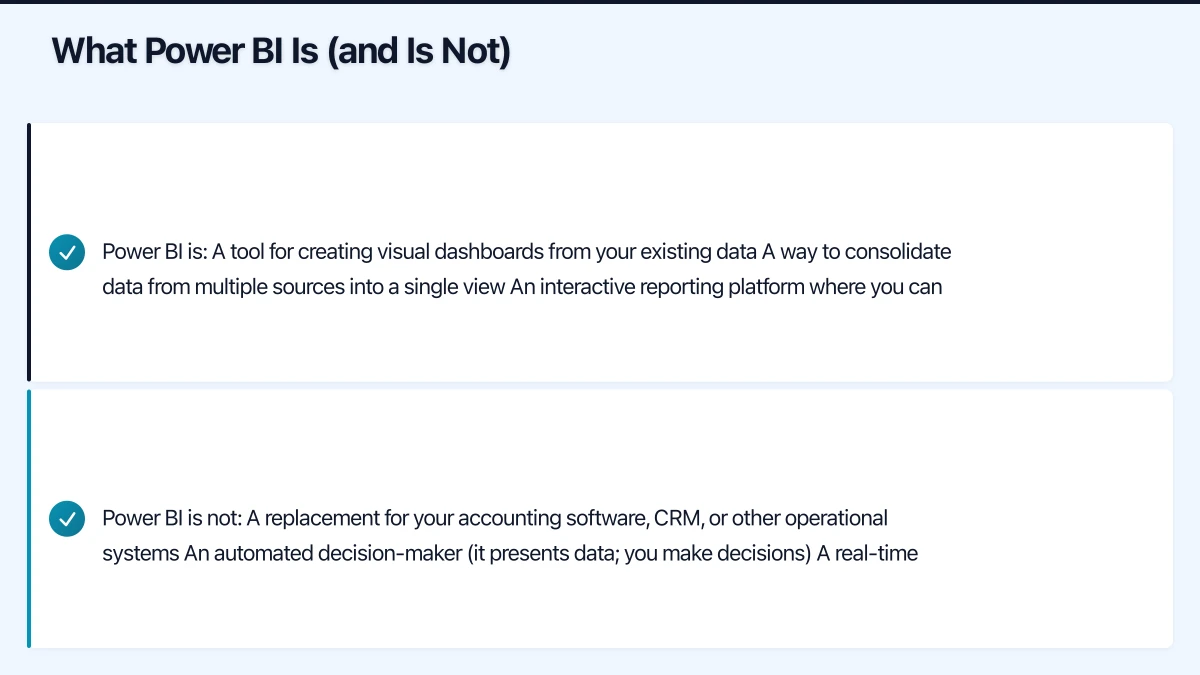
What Power BI Is (and Is Not)
Power BI is a data visualisation and analytics tool that connects to your business data sources, transforms the data, and presents it in interactive dashboards and reports.
Power BI is:
- A tool for creating visual dashboards from your existing data
- A way to consolidate data from multiple sources into a single view
- An interactive reporting platform where you can drill into details
- Available on desktop (Windows), web browser, and mobile devices
Power BI is not:
- A replacement for your accounting software, CRM, or other operational systems
- An automated decision-maker (it presents data; you make decisions)
- A real-time monitoring tool (data refreshes on a schedule, not in real time for most sources)
Power BI Pricing for Australian SMBs
Power BI Desktop (Free):
- Full data modelling and report creation capability
- Connect to over 100 data sources
- Create interactive visualisations
- Limitation: Reports live on your local machine and cannot be shared via the web
Power BI Pro ($14.80 per user per month in Australia):
- Everything in Desktop plus cloud-based sharing and collaboration
- Publish reports to the Power BI service
- Share dashboards with other Pro users
- Scheduled data refresh (up to 8 times per day)
- Included with Microsoft 365 E5 (not included in Business Premium)
Power BI Premium Per User ($28 per user per month):
- Everything in Pro plus advanced features
- Larger data models
- More frequent refresh (up to 48 times per day)
- AI capabilities and paginated reports
For most Australian SMBs, start with Power BI Desktop (free) to build your skills and create reports. When you need to share reports with your team via the web, upgrade the report creators and viewers to Pro licences. You do not need Premium for typical SMB use cases.
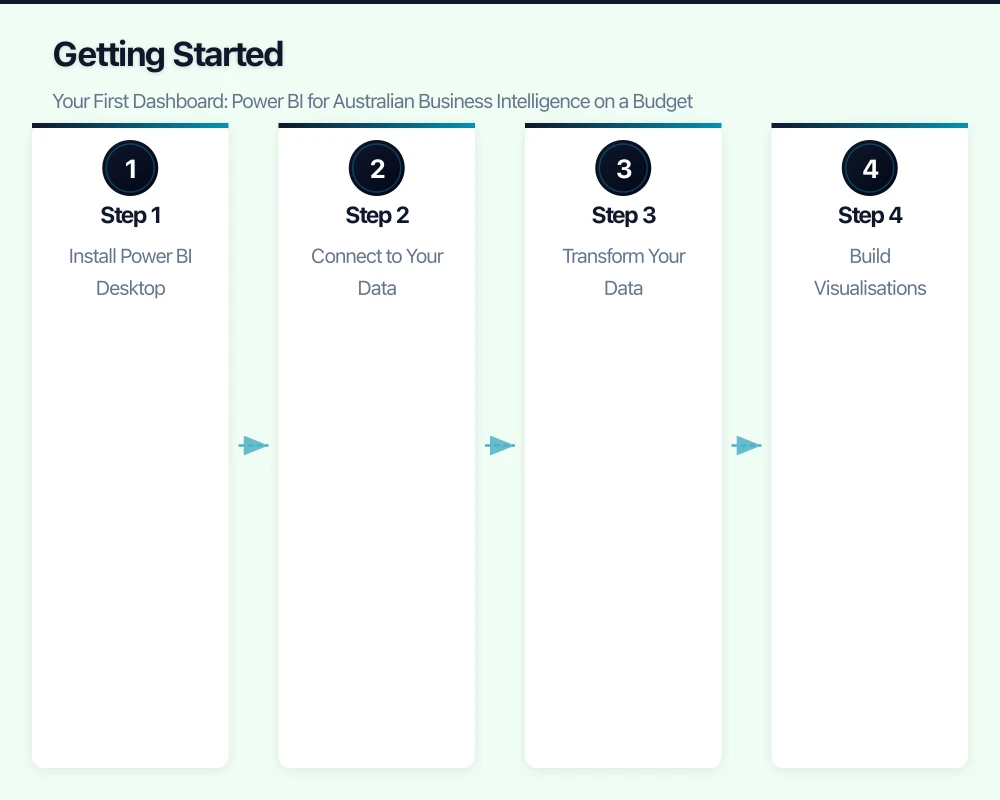
Getting Started: Your First Dashboard
Step 1: Install Power BI Desktop
Download Power BI Desktop from the Microsoft Store or powerbi.microsoft.com. It is a free Windows application. (Power BI Desktop is not available for Mac; Mac users can access shared reports through the web browser but cannot create reports natively.)
Step 2: Connect to Your Data
Power BI connects to a wide range of data sources. For Australian SMBs, the most relevant are:
Excel files: The easiest starting point. If your data lives in spreadsheets, Power BI can connect directly.
Accounting software:
- Xero: Use the Xero connector in Power BI. You will need to authorise Power BI to access your Xero data. This pulls in invoices, bills, contacts, bank transactions, and account balances.
- MYOB: MYOB does not have a native Power BI connector, but you can export data to Excel or CSV and import it. Third-party connectors are also available.
- QuickBooks Online: Native Power BI connector available.
Microsoft 365 data:
- SharePoint lists and libraries
- Excel files stored in OneDrive or SharePoint
- Microsoft Dataverse (if using Power Apps)
Databases:
- SQL Server (on-premise or Azure SQL)
- MySQL and PostgreSQL
- Azure databases
Web and marketing:
- Google Analytics
- Facebook Ads
- Mailchimp (via API or third-party connector)
Step 3: Transform Your Data
Raw data rarely comes in the perfect format for analysis. Power BI includes Power Query, a data transformation tool that lets you:
- Clean and format data (fix dates, standardise text, remove duplicates)
- Combine data from multiple sources (for example, join Xero invoice data with a CRM customer list)
- Create calculated columns (profit margin, days outstanding, year-over-year growth)
- Filter out irrelevant data
Power Query uses a visual interface that does not require coding, though the underlying M language is available for advanced transformations.
Step 4: Build Visualisations
Power BI offers a wide range of visualisation types:
- Bar and column charts (for comparisons)
- Line charts (for trends over time)
- Pie and donut charts (for proportions — use sparingly)
- Tables and matrices (for detailed data)
- Cards (for key metrics like total revenue, number of customers)
- Maps (for geographic data — useful for Australian businesses with national distribution)
- Gauges (for KPI tracking against targets)
Dashboard design principles:
- Start with the most important metrics at the top
- Use consistent colours (your brand colours work well)
- Limit each page to 5 to 8 visualisations (less is more)
- Include filters so users can drill into specific time periods, locations, or categories
- Add context: show comparisons to previous periods, targets, or benchmarks
Practical Dashboards for Australian SMBs
Financial Dashboard
Connect to: Xero or MYOB
Key metrics:
- Revenue (current month, year-to-date, vs. previous year)
- Expenses by category
- Profit margin trend
- Cash flow (money in vs. money out)
- Accounts receivable aging (who owes you money, and how overdue)
- Top 10 customers by revenue
Australian-specific features:
- Track revenue by financial year (July to June)
- Monitor GST collected vs. paid for BAS preparation
- Track superannuation liability
Sales Pipeline Dashboard
Connect to: CRM (HubSpot, Salesforce, Pipedrive) or sales spreadsheet
Key metrics:
- Pipeline value by stage
- Win rate (deals won vs. deals lost)
- Average deal size and sales cycle length
- Sales by rep (if applicable)
- Forecast vs. actual
Operational Dashboard
Connect to: Project management tool, timesheets, operational spreadsheets
Key metrics:
- Project profitability (revenue vs. costs per project)
- Utilisation rate (billable hours vs. total hours)
- Active projects and their status
- Resource allocation
- Customer satisfaction scores (if tracked)
IT Spending Dashboard
Connect to: Cloud cost data, software licence register, hardware asset register
Key metrics:
- Monthly IT spend trend
- Cost per employee
- Software licence utilisation (licences used vs. licences purchased)
- Cloud spending by service
- Hardware warranty expiry timeline
Tips for Success
Start Simple
Do not try to build a comprehensive enterprise dashboard on day one. Start with one data source and five to eight visualisations that answer your most pressing business questions. Build from there.
Data Quality Matters
Power BI is only as good as your data. If your Xero accounts are a mess, your Power BI dashboard will reflect that mess beautifully. Clean your source data before investing time in building reports.
Use Templates
Power BI has a template gallery with pre-built reports for common scenarios. Search for “Xero” or “financial” templates in the Power BI community gallery. These provide a starting point you can customise.
Schedule Regular Refreshes
If you publish reports to the Power BI service (Pro licence required), configure scheduled data refreshes. For most SMBs, a daily refresh before business hours is sufficient. This ensures your team sees current data when they check the dashboard each morning.
Train Your Team
Create a short guide (or a 15-minute walkthrough session) showing your team how to interact with Power BI reports. Key skills:
- How to use filters and slicers
- How to drill down into visualisations
- How to export data if needed
- What the key metrics mean and how to interpret them
Embed in Teams
If your team uses Microsoft Teams, you can add a Power BI tab to a Teams channel. This puts your dashboard where people already work, increasing adoption.
Connecting to Australian Data Sources
Xero to Power BI
- Open Power BI Desktop
- Click “Get Data” then search for “Xero”
- Authorise the connection with your Xero credentials
- Select the data tables you want (Invoices, BankTransactions, Contacts, Accounts, etc.)
- Load and transform the data as needed
Limitation: The Xero connector pulls data through the Xero API, which has rate limits. For businesses with very large transaction volumes (over 10,000 transactions per year), consider extracting data to a staging database for better performance.
Australian Bureau of Statistics (ABS) Data
Enrich your business data with ABS demographic and economic data:
- Import ABS datasets as CSV files
- Join with your business data by postcode, state, or industry code
- Add context like population growth, median income, or industry benchmarks
Australian Financial Year Handling
Power BI uses calendar years by default. For Australian financial year reporting:
- Create a custom date table with an “Australian Financial Year” column
- Use DAX formulas to calculate financial year:
FY = IF(MONTH([Date]) >= 7, YEAR([Date]) & "-" & YEAR([Date]) + 1, YEAR([Date]) - 1 & "-" & YEAR([Date])) - Use this column as your time axis for financial reporting
Common Pitfalls
Trying to visualise everything. Not every piece of data needs a chart. Focus on actionable metrics that drive decisions.
Ignoring mobile. Many business owners check dashboards on their phone. Test your reports on the Power BI mobile app and optimise layouts for small screens.
No data governance. If multiple people build reports, you can end up with conflicting numbers. Establish a single source of truth for key metrics.
Overcomplicating DAX. DAX (Data Analysis Expressions) is Power BI’s formula language. It is powerful but can become complex quickly. Start with simple measures and add complexity as needed.
Power BI puts business intelligence within reach of Australian small businesses. Start with the free desktop version, connect to your most important data source, and build a dashboard that answers the questions you ask every week. The return on that modest investment of time will be immediate and ongoing.
If your team needs on-the-go access to cloud-managed systems, Awesome Apps builds practical mobile solutions for Australian businesses.
This article is brought to you by Ganda Tech Services — Sydney’s complete digital solutions provider covering cloud, web, and mobile.