Network Monitoring Tools for Australian IT Teams

Network Monitoring Tools for Australian IT Teams
You cannot fix what you cannot see. For Australian IT teams — whether a one-person IT department in a 30-person company or a three-person team managing multiple offices — network monitoring is the difference between proactively resolving issues and spending your day responding to “is the internet down?” calls.
This guide reviews the network monitoring tools most relevant to Australian SMBs in 2022, with practical advice on what to monitor and how to set up alerting that actually helps.
What You Should Be Monitoring
Before choosing a tool, clarify what you need to monitor.
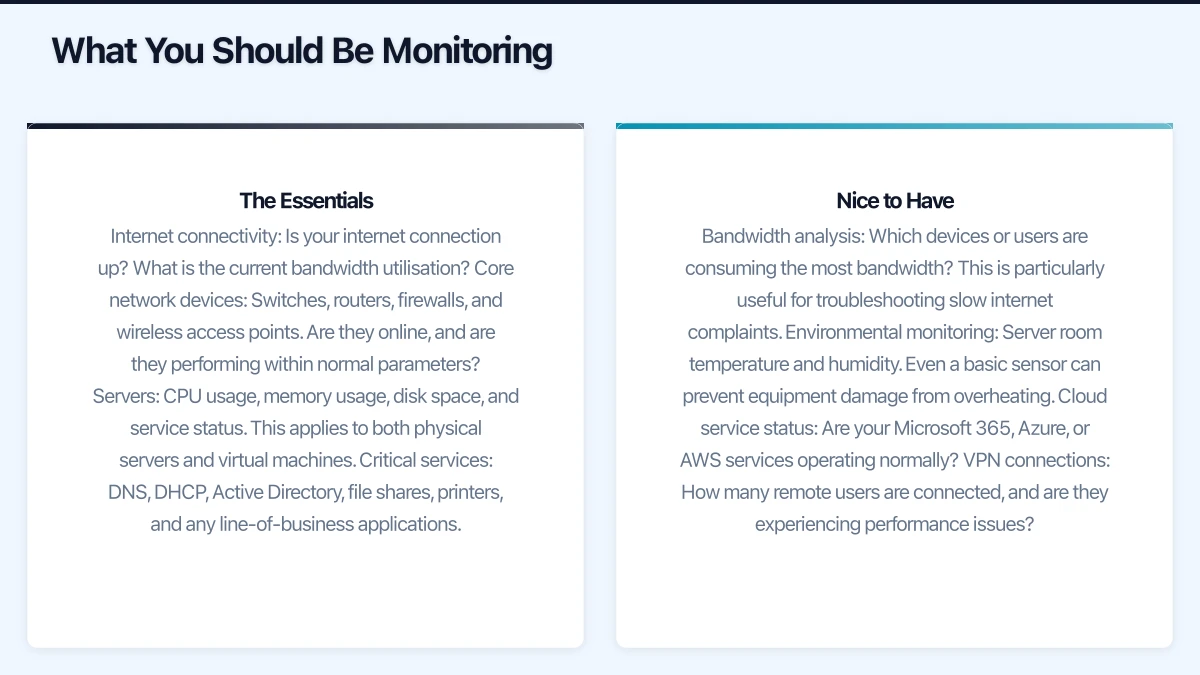
The Essentials
Internet connectivity: Is your internet connection up? What is the current bandwidth utilisation? Are you approaching your plan’s capacity?
Core network devices: Switches, routers, firewalls, and wireless access points. Are they online, and are they performing within normal parameters?
Servers: CPU usage, memory usage, disk space, and service status. This applies to both physical servers and virtual machines.
Critical services: DNS, DHCP, Active Directory, file shares, printers, and any line-of-business applications.
Nice to Have
Bandwidth analysis: Which devices or users are consuming the most bandwidth? This is particularly useful for troubleshooting slow internet complaints.
Environmental monitoring: Server room temperature and humidity. Even a basic sensor can prevent equipment damage from overheating.
Cloud service status: Are your Microsoft 365, Azure, or AWS services operating normally?
VPN connections: How many remote users are connected, and are they experiencing performance issues?
Free and Open-Source Options
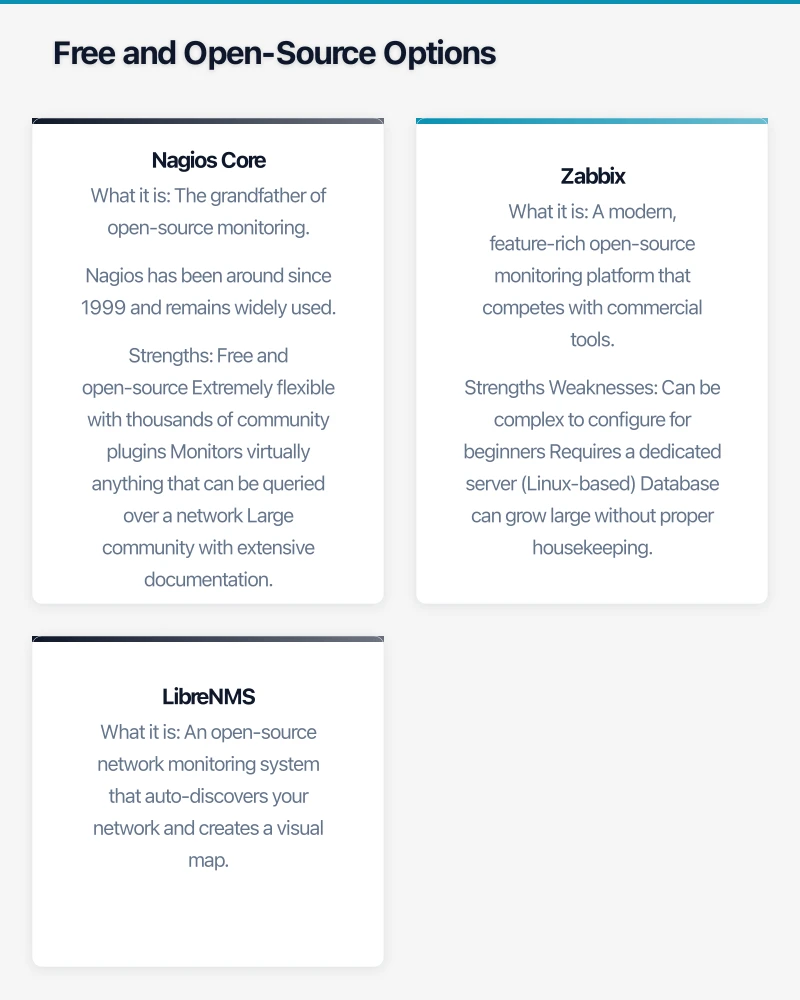
Nagios Core
What it is: The grandfather of open-source monitoring. Nagios has been around since 1999 and remains widely used.
Strengths:
- Free and open-source
- Extremely flexible with thousands of community plugins
- Monitors virtually anything that can be queried over a network
- Large community with extensive documentation
Weaknesses:
- The web interface looks dated
- Configuration is primarily through text files, which has a steep learning curve
- Requires a Linux server to run
- Graphing and reporting require additional plugins (PNP4Nagios, Grafana)
Best for: IT teams comfortable with Linux and command-line configuration who want maximum flexibility without licensing costs.
Getting started: Install on an Ubuntu or CentOS server (a virtual machine with 2 CPU cores and 4 GB RAM is sufficient for monitoring up to 100 devices). Use the Nagios Core documentation and community forums for guidance.
Zabbix
What it is: A modern, feature-rich open-source monitoring platform that competes with commercial tools.
Strengths:
- Free and open-source with no commercial restrictions
- Modern web interface with built-in graphing and dashboards
- Auto-discovery of network devices
- Supports SNMP, agent-based monitoring, and agentless checks
- Native support for monitoring cloud services
- Active development with regular updates
Weaknesses:
- Can be complex to configure for beginners
- Requires a dedicated server (Linux-based)
- Database can grow large without proper housekeeping
Best for: IT teams who want enterprise-grade monitoring without licensing costs and are willing to invest time in initial setup.
Getting started: Deploy on a Linux server using the official Zabbix packages. A virtual machine with 4 CPU cores, 8 GB RAM, and 50 GB SSD storage will comfortably monitor 200 devices. Zabbix provides pre-configured templates for common devices and services.
LibreNMS
What it is: An open-source network monitoring system that auto-discovers your network and creates a visual map.
Strengths:
- Free and open-source
- Excellent auto-discovery using SNMP
- Clean, modern web interface
- Good visual network maps
- Supports alerting via email, Slack, and Teams
Weaknesses:
- Primarily network-focused (less capable for server and application monitoring)
- Smaller community than Nagios or Zabbix
- Documentation can be inconsistent
Best for: IT teams who primarily need network device monitoring with good visualisation, and who want a quicker setup than Nagios or Zabbix.
Commercial Options
PRTG Network Monitor
What it is: A comprehensive monitoring platform from Paessler, popular with SMBs and MSPs.
Strengths:
- Intuitive web interface with drag-and-drop dashboard creation
- Free for up to 100 sensors (a sensor monitors one aspect of a device, such as CPU usage or a network interface)
- Very easy to set up compared to open-source alternatives
- Auto-discovery and pre-configured sensor templates
- Runs on Windows (familiar environment for many SMB IT teams)
- Mobile app for monitoring on the go
Weaknesses:
- Cost scales with the number of sensors: 500 sensors at approximately $2,500, 1,000 sensors at approximately $4,500 (one-time licence)
- Windows-only server
- Some advanced features require higher-tier licences
Best for: SMB IT teams who want comprehensive monitoring with minimal setup effort and are comfortable with a one-time licence cost.
Getting started: Download the free edition from paessler.com. Install on a Windows server or workstation. Run auto-discovery against your network to automatically create sensors for discovered devices.
Australian note: For 100 sensors, PRTG is free. A typical Australian SMB with 20 devices will use approximately 100 to 200 sensors, so you may stay within the free tier for basic monitoring.
Auvik
What it is: A cloud-based network management and monitoring platform designed for MSPs and IT teams.
Strengths:
- Cloud-hosted — no server to maintain
- Automatic network mapping and topology visualisation
- Excellent for multi-site monitoring
- Configuration backup for network devices
- Simple, modern interface
Weaknesses:
- Subscription pricing (approximately $150 to $300 per month for SMBs, varies by device count)
- Requires an on-site collector appliance or virtual machine
- Primarily network-focused
Best for: SMBs with multiple office locations or IT teams managing several client sites. The network mapping and configuration backup features justify the subscription cost for complex environments.
Datadog
What it is: A cloud-based monitoring and analytics platform for infrastructure, applications, and logs.
Strengths:
- Comprehensive monitoring across infrastructure, applications, and cloud services
- Excellent integration with cloud platforms (Azure, AWS, Google Cloud)
- Modern interface with powerful dashboards
- No on-premise server required
Weaknesses:
- Pricing can escalate quickly (approximately $23 per host per month for infrastructure monitoring)
- Overkill for businesses that only need basic network monitoring
- More suited to DevOps teams than traditional IT teams
Best for: Businesses with significant cloud infrastructure who need unified monitoring across on-premise and cloud environments.
Setting Up Effective Alerting
The monitoring tool is only as good as its alerting configuration. Poorly configured alerts lead to alert fatigue, where your team ignores alerts because there are too many false positives.
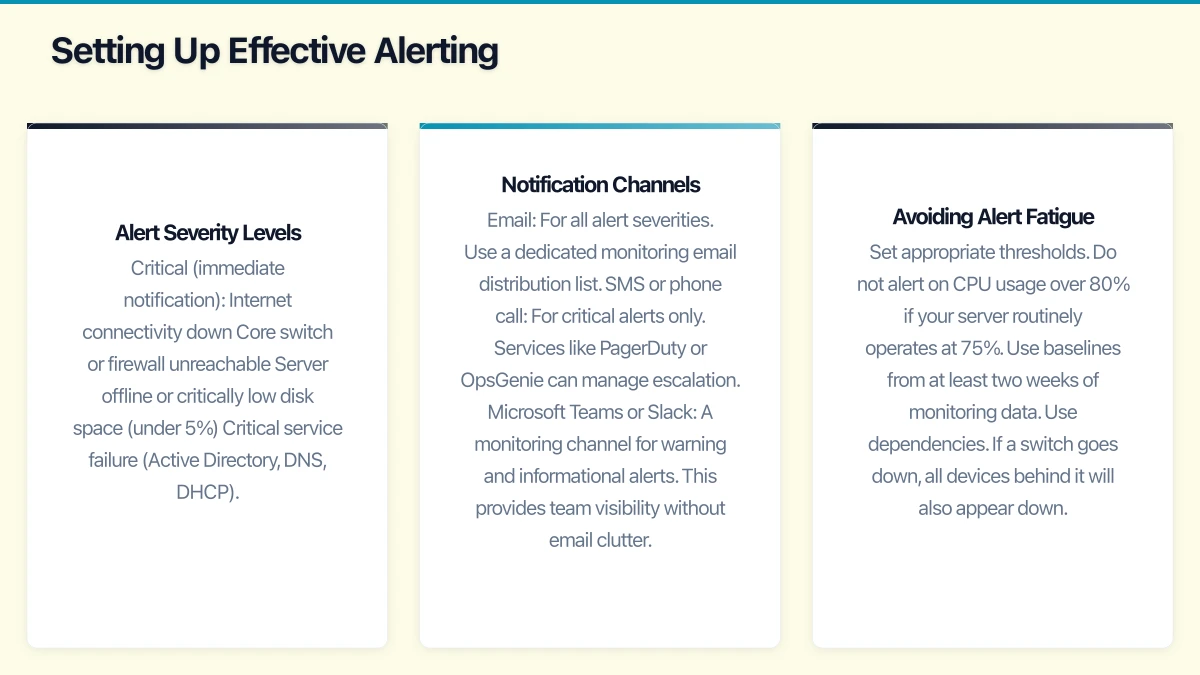
Alert Severity Levels
Configure three tiers of alerts:
Critical (immediate notification):
- Internet connectivity down
- Core switch or firewall unreachable
- Server offline or critically low disk space (under 5%)
- Critical service failure (Active Directory, DNS, DHCP)
Warning (business hours notification):
- High CPU or memory usage (over 90% sustained)
- Disk space below 20%
- Interface errors on network devices
- Backup job failures
- Certificate expiring within 30 days
Informational (daily digest):
- Device reboots
- Non-critical service restarts
- Bandwidth utilisation approaching capacity
- New devices detected on the network
Notification Channels
Configure multiple notification channels:
- Email: For all alert severities. Use a dedicated monitoring email distribution list.
- SMS or phone call: For critical alerts only. Services like PagerDuty or OpsGenie can manage escalation.
- Microsoft Teams or Slack: A monitoring channel for warning and informational alerts. This provides team visibility without email clutter.
Avoiding Alert Fatigue
- Set appropriate thresholds. Do not alert on CPU usage over 80% if your server routinely operates at 75%. Use baselines from at least two weeks of monitoring data.
- Use dependencies. If a switch goes down, all devices behind it will also appear down. Configure parent-child relationships so you get one alert for the switch rather than twenty alerts for everything behind it.
- Schedule maintenance windows. Suppress alerts during planned maintenance to avoid false notifications.
- Review and tune regularly. Spend 30 minutes each week reviewing alerts from the past seven days. Eliminate false positives and adjust thresholds.
Monitoring Australian Internet Connections
Australian internet connections have their own quirks that affect monitoring.
NBN connections: Monitor both download and upload bandwidth. Many NBN plans have asymmetric speeds, and upload saturation is a common cause of poor performance when multiple staff are on video calls.
Failover connections: If you have a backup internet connection (4G/5G failover, secondary NBN connection), monitor both connections and test failover regularly.
Latency monitoring: Set up ping monitoring to key services:
- Your ISP’s gateway (first hop)
- A reliable Australian target (such as 8.8.8.8 or an Australian DNS server)
- Critical cloud services (outlook.office365.com, your Azure gateway)
Typical healthy latency values for Australian businesses:
- To ISP gateway: Under 5 ms
- To Australian cloud services: 5 to 30 ms (varies by location)
- To US-based services: 150 to 250 ms
- To European services: 250 to 350 ms
If latency to your ISP gateway exceeds 10 ms consistently, contact your ISP. The problem is likely on their network or the connection to your premises.
Putting It All Together
For a typical Australian SMB with 20 to 50 staff:
-
Start with PRTG Free (100 sensors) if you want the fastest path to monitoring. Install it on an existing Windows server or workstation, run auto-discovery, and you will have basic monitoring within an hour.
-
Choose Zabbix if you have Linux skills and want comprehensive monitoring without ongoing licensing costs. Expect to spend a weekend on initial setup.
-
Use Auvik if you manage multiple sites or need network topology mapping. The subscription cost is justified by the automation and visibility it provides.
-
Add Uptime Robot (free for up to 50 monitors) for external monitoring of your website and public-facing services. This provides an outside-in perspective that complements your internal monitoring.
Regardless of the tool you choose, monitoring is not a set-and-forget activity. Schedule regular reviews of your monitoring setup, adjust thresholds as your environment changes, and use the data to make informed decisions about infrastructure investments.
The best time to implement monitoring was before your last outage. The second best time is now.
Pair your cloud backend with a polished mobile experience. Awesome Apps develops apps for iOS and Android that keep your team and customers connected.
This article is brought to you by Ganda Tech Services — Sydney’s complete digital solutions provider covering cloud, web, and mobile.